Data analytics has stayed near the top of every “fastest-growing career path” list for a reason that has nothing to do with hype: nearly every company now collects far more data than it has people qualified to interpret. Organizations across entertainment, finance, healthcare, retail, and tech all need someone who can take a messy spreadsheet or database and turn it into a decision. That gap between data being collected and data being understood is exactly what a data analyst is hired to close, and it’s why demand for the role hasn’t slowed down even as the broader tech hiring market has gotten more selective.
Into that gap, Google launched the Google Data Analytics Professional Certificate back in 2021, and it has since become one of the most recognized beginner-to-entry-level programs in the field — not because it’s flashy, but because it was built with a specific, practical goal: take someone with zero data background and get them job-ready for an entry-level analytics role, without requiring a degree.
This review covers everything you actually need to decide if it’s worth your time and money: the full nine-course curriculum (including its 2026 shift from R to Python), real cost figures, how long it actually takes, who it’s genuinely useful for versus who should skip it, how the credential is perceived by employers, and how it stacks up against IBM’s Data Analyst certificate, Microsoft’s Power BI certificate, and Google’s own more advanced Business Intelligence certificate.
Quick Verdict
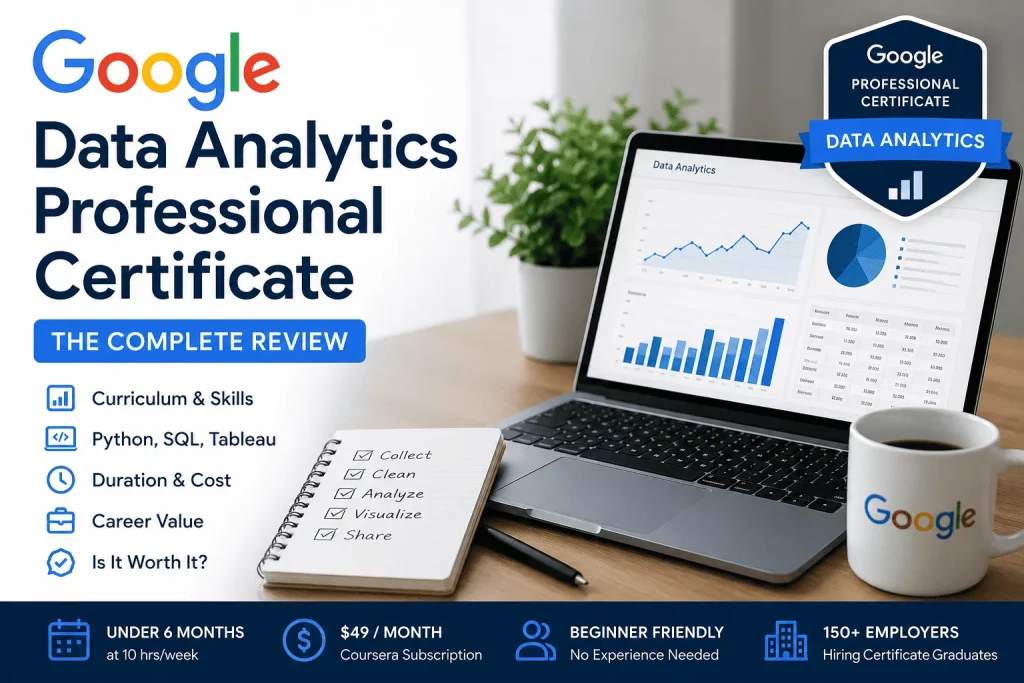
Is the Google Data Analytics Professional Certificate worth it? Yes, for absolute beginners who want a structured, affordable, self-paced path into an entry-level data analytics role. It teaches the real tools entry-level analysts use daily — spreadsheets, SQL, Tableau, and now Python — through a project-based curriculum that ends in a portfolio-ready capstone case study, and it comes with access to a consortium of 150+ U.S. employers who consider certificate graduates for open roles.
It is not worth it for people who already have solid SQL, spreadsheet, and visualization skills — the content will feel introductory, and your time is better spent on a more advanced credential or on building a portfolio directly. At roughly $49/month and about 180 hours of content spread across six months, it’s a low-cost, low-risk way to test whether data analytics is a career worth pursuing before committing to something heavier, like a bootcamp or a master’s degree.
Course Snapshot
| Category | Details |
|---|---|
| Provider | Google (Google Career Certificates) |
| Platform | Coursera |
| Level | Beginner — no degree or experience required |
| Certificate type | Professional Certificate (9-course series) |
| Duration | Under 6 months at ~10 hours/week (180+ hours of total instruction) |
| Cost | $49/month (U.S. and Canada); ~$300 total for a typical 6-month pace |
| Projects | Hands-on labs in every course, plus a final capstone case study |
| Prerequisites | None |
| Tools taught | Google Sheets/Excel, SQL, Tableau, Python |
| Credential | Shareable certificate + Credly badge, with ACE (up to 12 college credits) or ECTS (7 credits) recommendation |
| Enrollment | 3.7 million+ learners |
| Rating | 4.8 out of 5 across roughly 180,000 course reviews |
| Employer network | 150+ U.S. employers, including Deloitte, Target, Verizon, and Google itself |
What Is the Google Data Analytics Professional Certificate?
Purpose. The certificate exists to take someone with no data background at all and prepare them for an entry-level analytics role — titles like Junior Data Analyst, Business Analyst, or Reporting Analyst. It was built by Google’s own data analytics team, drawing on the same on-the-job skills those employees use daily, rather than a purely academic curriculum.
Learning objectives. By the end, you should be able to complete the full analytics workflow independently: ask the right business question, collect and organize data, clean it, analyze it, visualize it, and present findings to a non-technical audience. The program frames this as the “problem-solving road map” that shows up repeatedly across every course.
Industry relevance. The tools taught — spreadsheets, SQL, Tableau, and Python — are the same tools listed on the overwhelming majority of entry-level data analyst job postings. That alignment between curriculum and actual job requirements is the certificate’s biggest structural strength: it isn’t teaching data science theory in the abstract, it’s teaching the specific, narrow skill set hiring managers screen for in junior roles.
Who Should Take This Certificate?
Students. A strong complement to a degree in almost any field — business, social sciences, humanities — since it adds a concrete, in-demand technical skill set that most degree programs don’t teach directly. It also carries an ACE credit recommendation, which some institutions will accept toward degree credit.
Career changers. This is the certificate’s core audience. If you’re moving into data analytics from teaching, retail management, hospitality, admin work, or any non-technical background, the zero-prerequisite structure and step-by-step build from spreadsheets through SQL to Python is specifically designed for exactly this transition.
Business professionals. Useful for anyone in operations, finance, or general management who wants to stop depending on someone else to pull and interpret reports. Even without a job title change, the SQL and spreadsheet skills alone tend to pay for themselves in day-to-day efficiency.
Marketing professionals. Marketing increasingly runs on campaign data, attribution, and performance dashboards. The data visualization and storytelling components of this certificate map directly onto building marketing reports and presenting results to stakeholders.
Government employees. Public-sector roles increasingly require basic data literacy for budget analysis, program evaluation, and reporting. The certificate’s emphasis on data ethics and structured, defensible analysis is particularly relevant in public-sector contexts where decisions face public scrutiny.
Small business owners. For owners who currently make decisions on gut instinct or basic spreadsheet totals, the certificate provides a structured way to actually mine sales, customer, and operational data for decisions — without hiring a dedicated analyst.
Who Should Skip It?
Experienced data analysts. If you’re already working as an analyst and comfortable with SQL joins, pivot tables, and dashboard tools, this certificate will feel far too basic. Your time is better spent on a specialized skill (advanced SQL, statistics, a BI platform certification) rather than repeating fundamentals.
Senior BI professionals. Anyone already building complex dashboards, managing data governance, or leading a BI function won’t gain much here. Google’s own Advanced Data Analytics or Business Intelligence Professional Certificates — built as follow-ons specifically for graduates of this program — are a better fit.
Advanced data scientists. This certificate does not cover machine learning, predictive modeling, or statistical inference at any depth. Data scientists or aspiring data scientists should look at Google’s Advanced Data Analytics Professional Certificate, IBM’s Data Science Professional Certificate, or a DeepLearning.AI specialization instead.
What You’ll Learn
Data analytics fundamentals. The full analytical workflow: asking the right questions, understanding data ecosystems, and applying structured thinking to a business problem before touching a single tool.
Spreadsheets. Organizing, cleaning, and calculating in Google Sheets and Excel — sorting, filtering, functions, and pivot tables — as the entry point into hands-on data work.
SQL. Writing queries against relational databases, including joins, aggregations, and subqueries, to pull and combine data across multiple tables. This is consistently the single most job-relevant skill in the program, since SQL proficiency appears in nearly every entry-level analyst job posting.
Data cleaning. Identifying and fixing data integrity issues, applying SQL functions to clean string variables, verifying cleaning results, and understanding sampling and bias — the unglamorous work that in practice consumes a large share of a working analyst’s time.
Data visualization. Turning cleaned, analyzed data into charts, graphs, and dashboards that a non-technical audience can actually understand and act on.
Tableau. Hands-on practice building interactive visualizations and dashboards in one of the industry’s most widely used BI platforms.
Programming language: Python (not R). As of the certificate’s 2026 curriculum update, Google now teaches Python instead of R. Google’s own program FAQ is explicit about this: Python has become the industry-standard language for data manipulation, analysis, and visualization, and while the program no longer covers R, learners are encouraged to explore it independently after finishing if they want to. If you’ve seen older reviews referencing R programming, ggplot2, or RStudio as part of this certificate — that reflects the pre-2026 curriculum and is no longer accurate.
Capstone project. A full, self-directed case study applying the entire analytics process — from asking a business question through cleaning, analyzing, visualizing, and presenting — to a real dataset, producing a portfolio piece you can show directly to employers.
How the Certificate Is Actually Taught
Before getting into the course-by-course breakdown, it helps to understand the teaching format itself, since it shapes how realistic the time estimates are for different types of learners.
Each course combines short video lessons (typically 5–15 minutes), readings, low-stakes practice quizzes, and graded hands-on labs that run inside Coursera’s browser-based tools — meaning you don’t need to install SQL software, Tableau, or Python locally to complete the coursework, though setting up your own local environment is encouraged for anyone planning to keep practicing afterward. Instruction is delivered by actual Google employees working in data analytics roles, who narrate real examples from their own jobs rather than generic textbook scenarios, which is part of why the certificate feels more applied than a typical university-style MOOC.
Assessment is weighted heavily toward doing the work rather than memorizing it: peer-reviewed projects, graded lab exercises with rubrics, and a capstone that’s evaluated as a completed deliverable rather than a multiple-choice test. This matters for how you should budget your time — someone who reads quickly but needs longer to work through a genuine SQL query or a Tableau dashboard build should expect the “10 hours a week” estimate to run a bit higher during the SQL- and Python-heavy weeks in particular.
Curriculum Breakdown: All 9 Courses
The certificate is a nine-course sequence (expanded from its original eight courses with the addition of a dedicated Python course and a bonus AI-powered job-search course). Google recommends taking the courses in order, since each one builds on the last.
Course 1 — Foundations: Data, Data, Everywhere (13 hours) Key topics: what data analytics is, data ecosystems, the analytical thinking framework, the role of a data analyst. Practical skills: self-assessing your own analytical thinking, understanding where spreadsheets, SQL, and visualization tools fit in the workflow. Learning outcome: a clear picture of what a data analyst actually does day to day, and the vocabulary to talk about the field.
Course 2 — Ask Questions to Make Data-Driven Decisions (15 hours) Key topics: the problem-solving road map, structured thinking, spreadsheet basics. Practical skills: entering and organizing data in spreadsheets, framing the right business question before starting analysis. Learning outcome: the ability to translate a vague business ask into a specific, answerable analytical question.
Course 3 — Prepare Data for Exploration (19 hours) Key topics: data collection, bias vs. unbiased data, database structure, data organization best practices. Practical skills: evaluating data sources for quality and bias, understanding relational databases and metadata. Learning outcome: knowing how to judge whether a dataset is trustworthy and properly organized before analyzing it.
Course 4 — Process Data from Dirty to Clean (16 hours) Key topics: data integrity, SQL fundamentals, data cleaning verification. Practical skills: writing basic SQL queries, applying SQL string functions to clean data, checking cleaning results for accuracy. Learning outcome: the ability to take a messy raw dataset and turn it into something analysis-ready.
Course 5 — Analyze Data to Answer Questions (26 hours) Key topics: sorting and filtering, data formatting and conversion, multi-table SQL queries, spreadsheet calculations. Practical skills: combining data across tables with SQL joins, performing calculations with spreadsheet functions. Learning outcome: running a full analysis end-to-end and drawing a defensible conclusion from the data.
Course 6 — Share Data Through the Art of Visualization (19 hours) Key topics: visualization principles, Tableau, data storytelling, presentation design. Practical skills: building dashboards and charts in Tableau, structuring a data-driven narrative for stakeholders. Learning outcome: the ability to present findings clearly to a non-technical audience — arguably the most underrated skill in the entire program.
Course 7 — Introduction to Data Analysis Using Python (27 hours) Key topics: Python syntax and semantics, loops and control statements, data structures, object-oriented basics. Practical skills: writing Python scripts for data manipulation and cleaning, working with data using Python’s core libraries. Learning outcome: baseline programming literacy that extends what spreadsheets and SQL can do, and the single biggest addition separating the current curriculum from the older R-based version.
Course 8 — Google Data Analytics Capstone: Complete a Case Study (11 hours) Key topics: end-to-end case study execution, portfolio building, AI-assisted analysis. Practical skills: applying the full analytics process independently to a real dataset, using AI to help with data visualization ideas, data cleaning, and structuring. Learning outcome: a completed, shareable case study that functions as the centerpiece of your job-application portfolio.
Course 9 — Accelerate Your Job Search with AI (6 hours) Key topics: career exploration with Google’s Career Dreamer tool, resume building, interview preparation. Practical skills: using Gemini to draft and refine a resume, practicing interview responses with Gemini Live and Gemini Notebook, organizing a job search in Google Sheets. Learning outcome: a completed resume and structured job-search plan, not just technical skills — this bonus course is Google folding its AI tools directly into the career-outcome side of the certificate.
Hands-On Projects
Nearly every course includes a graded, hands-on lab that simulates a real workplace scenario rather than a multiple-choice quiz alone — cleaning an actual messy dataset, writing SQL against sample databases, building a Tableau dashboard from scratch. These accumulate into a body of work you can speak to directly in interviews.
The capstone case study is the portfolio centerpiece. You select a business scenario, then independently execute the full analytics process — asking questions, sourcing and cleaning data, analyzing it, and building a final presentation of your findings. Graduates commonly host this case study on a personal website, GitHub, or LinkedIn as tangible proof of applied skill, and multiple certificate reviewers and testimonials point specifically to the capstone as what actually got them interviews — not the certificate title itself, but the demonstrable project behind it.
Certificate Value
Employer recognition. Google Career Certificates are broadly recognized, particularly among companies that have partnered directly with Google’s employer consortium — over 150 U.S. employers, including Deloitte, Target, Verizon, Infosys, Wells Fargo, and Google itself, consider certificate graduates for open entry-level roles. That said, recognition varies by company and hiring manager; it functions as a credible signal of applied skill, not a guaranteed interview.
Resume impact. Because the certificate is tied to concrete tools (SQL, Tableau, Python) rather than vague soft-skill claims, it reads well on a resume specifically because it maps to skills recruiters are actively filtering for in applicant tracking systems.
LinkedIn profile. The certificate is directly shareable to LinkedIn’s Licenses & Certifications section via its Credly badge, complete with a verification link recruiters can click through.
Industry credibility. The Google brand carries general credibility, and the certificate’s ACE recommendation (up to 12 college credits) or ECTS recommendation (7 credits) gives it a degree of institutional legitimacy that most short-form online certificates lack — some universities will accept it toward degree credit, though this is decided school by school and never guaranteed.
How hiring managers actually treat it. It’s worth being realistic about what the credential does and doesn’t do in a hiring process. Most hiring managers don’t treat the certificate title alone as proof of job-readiness — what tends to move an application forward is the combination of the certificate plus a visible capstone project plus how you talk about your analytical thinking in an interview. Treat the certificate as the credibility floor that gets your resume a second look, not the ceiling that gets you hired. The strongest use of the credential is pairing it with a personal project on a real dataset you chose yourself (Kaggle datasets, public government data, or your own small business’s numbers all work well), since that shows initiative beyond the guided coursework.
Career Opportunities
Common entry points after completing the certificate include:
- Junior Data Analyst — the most direct target role, applying the full toolkit (spreadsheets, SQL, Tableau, Python) to day-to-day reporting and analysis.
- Business Analyst — translating data findings into business recommendations, often with heavier stakeholder communication.
- Marketing Analyst — applying the same analytical process to campaign performance, attribution, and customer data.
- Operations Analyst — using data to improve internal processes, supply chain, or resource allocation.
- Reporting Analyst — focused on building and maintaining recurring dashboards and reports for internal teams.
Additional titles graduates have moved into include HR/Payroll Analyst, Finance Analyst, Healthcare Analyst, and Business Intelligence Analyst — reflecting how portable the core skill set is across industries.
What these roles actually look like day to day:
- A Junior Data Analyst typically spends their week pulling data via SQL, cleaning it in spreadsheets or Python, and producing recurring or ad hoc reports for a manager or a specific team. Expect close supervision early on, with growing analytical independence over the first year.
- A Business Analyst spends comparatively less time in raw data and more time translating findings into recommendations — sitting in stakeholder meetings, scoping what a team actually needs to know, and presenting conclusions rather than just producing them.
- A Marketing Analyst works inside marketing-specific data (campaign performance, web analytics, customer segmentation) and typically partners closely with a marketing or growth team, often using visualization tools to build recurring performance dashboards.
- An Operations Analyst applies the same analytical process to internal processes — inventory, logistics, staffing, efficiency — and tends to work cross-functionally with operations and finance teams.
- A Reporting Analyst is the most dashboard-centric of the five, focused on building, maintaining, and automating recurring reports so that other teams don’t have to pull the numbers themselves.
Because the certificate deliberately teaches transferable tools rather than industry-specific knowledge, the same skill set applies whether you land in tech, healthcare, retail, or the public sector — the tools stay the same even as the data changes.
Salary Outlook
It’s worth being direct here: no certificate — from Google or anyone else — can guarantee a specific salary, and you should be skeptical of any review that states one as a promise. What can be said accurately is that data analytics as a field commands strong entry-level compensation relative to its low barrier to entry, and that the skills this certificate teaches are the same ones tied to that demand. Google’s own program page cites Lightcast job-postings data showing over 270,000 open data analytics jobs in the U.S. with a median entry-level salary around $97,000 — a figure describing current market demand for the role, not an outcome promise attached to this certificate specifically.
Actual salary outcomes depend heavily on factors outside the certificate itself: your location, the specific industry you enter, whether you’re transitioning from a related field or starting from zero, how strong your capstone portfolio is, and how well you perform in interviews. Google reports that 75% of certificate graduates in its outcome survey experienced a positive career outcome — a new job, a promotion, or a raise — within six months of completion, which is a meaningfully positive signal, but it’s a self-reported survey result, not a guarantee applicable to every individual learner.
Google Data Analytics Professional Certificate Cost
Coursera subscription. The certificate runs $49 per month in the U.S. and Canada after an initial 7-day free trial. Pricing may be lower in some other countries.
Free trial. Coursera’s standard 7-day free trial lets you preview course content, but — as with Google’s other certificates — you can’t complete the graded work or earn the actual certificate during that free window.
Financial aid. Coursera offers financial aid for qualifying learners, applied for directly through the certificate’s enrollment page, which can reduce the cost significantly or eliminate it for approved applicants.
Estimated total cost. At the recommended pace of under 10 hours per week, most learners complete the full nine-course program in under six months, putting the typical total cost under $300 (roughly 6 monthly payments of $49, though many learners who study more intensively finish faster and pay less). If you already subscribe to Coursera Plus, the certificate is included at no additional charge.
Can You Take It for Free?
Audit options. Coursera allows free preview of the first module of many courses, including video lessons and some readings, without payment. This gives you a genuine feel for the teaching style before committing.
Free trial. The 7-day free trial provides broader access to course content, but graded assignments and the final certificate require an active paid subscription.
Financial aid limitations. Financial aid can bring the cost to $0 for approved applicants, but approval isn’t automatic — it requires submitting an application explaining your financial situation and career goals, and processing takes time, so it shouldn’t be treated as a same-day free option.
The honest bottom line: you can meaningfully evaluate whether this certificate is right for you at no cost through previews and the trial period, but earning the actual credential requires either payment or an approved financial aid application.
Time Commitment
Weekly study plan. Google’s official estimate is under 10 hours per week to finish within 6 months — roughly 1.5 hours per weekday, or a couple of longer weekend sessions.
Fast-track completion. Learners who dedicate 15–20 hours per week can realistically finish in 2–3 months, particularly if they have some prior spreadsheet or basic technical comfort.
Self-paced schedule. There are no deadlines within the program — you can pause, resume, and stretch the timeline out well beyond 6 months if needed, which matters if you’re balancing this around a full-time job.
Given that Courses 5 and 7 (Analyze Data, and the new Python course) are the longest and most technically dense, expect those two weeks to require more focused time than the others — budgeting extra hours there rather than assuming a flat weekly pace across every course will keep your schedule realistic.
Pros
- Zero prerequisites, genuinely accessible to complete beginners
- Teaches Python, SQL, Tableau, and spreadsheets — the actual tools entry-level job postings ask for
- Strong hands-on, project-based structure that culminates in a real portfolio piece
- Backed by a 150+ U.S. employer consortium that considers graduates for open roles
- Affordable relative to a bootcamp or degree, with legitimate financial aid available
- ACE and ECTS credit recommendations add unusual institutional weight for a short-form certificate
- Self-paced and fully online, fitting around a full-time job
- Bonus AI-powered job search course (resume, interview prep) built directly into the program
- Large, well-established program with a long track record and a large volume of graduate reviews (4.8/5 across ~180,000 reviews)
Cons
- Fundamentally an entry-level program — offers no meaningful value to experienced analysts or BI professionals
- No coverage of machine learning, predictive modeling, or advanced statistics
- The certificate title alone doesn’t guarantee interviews or a specific salary — outcomes depend heavily on your portfolio and interview performance
- 6-month recommended timeline is a real time investment if studied at the suggested pace
- Recently switched from R to Python, so some older third-party reviews and tutorials referencing R are now outdated
- The employer consortium and language availability are strongest in the U.S.; benefits may be less pronounced outside it
- A single, widely held credential — as adoption grows, differentiation increasingly depends on your capstone and portfolio rather than the certificate title itself
Comparison
Google Data Analytics vs. IBM Data Analyst
Both are 9-course (or similarly structured), beginner-oriented, Coursera-hosted programs with no prerequisites, and both culminate in a capstone project. The core difference is depth of programming instruction: Google teaches Python within a broader analytics workflow, while IBM’s Data Analyst track goes somewhat deeper into Python’s data-science libraries (Pandas, NumPy, Matplotlib, Seaborn) and includes more exposure to tools like JupyterLab and IBM Cognos for dashboards. IBM also separately offers an “IBM Data Analytics with Excel and R” track for learners who specifically want R instead of Python — a choice Google no longer offers now that it has moved fully to Python. In practice, the two programs are close competitors for the same beginner audience; Google’s brand recognition and employer consortium give it a slight edge for general hiring visibility, while IBM’s track leans marginally more technical.
Google Data Analytics vs. Microsoft Power BI
These serve different goals. The Microsoft Power BI Data Analyst Professional Certificate is built around a single tool — Power BI — and is explicitly designed to prepare you for Microsoft’s PL-300 certification exam (completers even receive a 50% exam discount voucher). It’s the better choice if your target employer already runs on the Microsoft stack, or if you specifically want an industry-recognized Microsoft certification alongside your Coursera credential. Google’s certificate is broader — covering the full analytics workflow across multiple tools (spreadsheets, SQL, Tableau, Python) rather than mastering one platform — making it the stronger starting point for someone who doesn’t yet know which BI ecosystem they’ll end up working in.
Google Data Analytics vs. Google Business Intelligence Certificate
These aren’t really competitors — they’re sequential. The Google Business Intelligence Professional Certificate is explicitly an advanced-level program that assumes you’ve already completed the Data Analytics certificate or have equivalent experience; it’s a shorter, three-to-four-course track (about 2 months at 10 hours/week) focused specifically on BI processes, data modeling, and dashboarding/reporting for BI Analyst and BI Engineer roles. If you’re a true beginner, Data Analytics is the correct starting point. Once you’re working in the field or have finished that program, Business Intelligence is the logical next step for career advancement.
Side-by-Side Summary
| Google Data Analytics | IBM Data Analyst | Microsoft Power BI Data Analyst | Google Business Intelligence | |
|---|---|---|---|---|
| Level | Beginner | Beginner | Beginner | Advanced (requires prior experience) |
| Courses | 9 | 9 | 8 | 3–4 |
| Core language | Python | Python (R variant also available) | None (low-code, DAX formulas) | Builds on Data Analytics skills |
| Signature tool | Tableau | Cognos, JupyterLab | Power BI | Looker-style BI tooling |
| Industry exam tie-in | None | None | Prepares for Microsoft PL-300 | None |
| Typical duration | ~6 months at 10 hrs/week | ~4–5 months at 10 hrs/week | ~3 months at 10 hrs/week | ~2 months at 10 hrs/week |
| Best for | General entry into the field | Slightly more technical entry path | Microsoft-stack employers | Career advancement after entry-level |
Common Mistakes to Avoid
Even with a well-structured program, a few avoidable mistakes account for most of the frustration learners report:
- Skipping the hands-on labs to save time. The videos alone don’t build the muscle memory needed for a SQL or Python technical interview — the labs are where the actual skill-building happens, and skipping them is the single most common reason graduates report feeling underprepared for interviews.
- Treating the capstone as a formality. A rushed, minimal-effort capstone produces a weak portfolio piece. Employers and recruiters who look at it can tell the difference between a checkbox exercise and a project you clearly invested real thought into.
- Not building anything beyond the required coursework. The certificate teaches the tools; it doesn’t teach you to stand out. Layering on one or two independent projects using your own chosen dataset meaningfully strengthens a resume that would otherwise look identical to thousands of other graduates.
- Assuming the certificate alone will generate interviews. It’s one input into a job search, not a replacement for tailoring resumes, actively applying, and networking within the employer consortium and beyond it.
- Ignoring the shift from R to Python if referencing older guides. If you’re following a study plan, YouTube walkthrough, or third-party guide written before the 2026 curriculum update, double-check it isn’t describing the old R-based courses — the actual Coursera curriculum today teaches Python throughout.
Atlas Decision Matrix™
Use this to match the certificate to your actual goal rather than a generic “worth it or not” judgment:
- Goal: break into data analytics with zero background → Google Data Analytics is the strongest fit on this list.
- Goal: master one specific BI tool for a Microsoft-stack employer → Microsoft Power BI Data Analyst is the better fit.
- Goal: go slightly more technical with Python libraries and dashboarding tools like Cognos → IBM Data Analyst is a strong parallel option.
- Goal: advance beyond entry-level after finishing Google’s beginner track → Google Business Intelligence (or Google Advanced Data Analytics, for a more machine-learning-oriented path) is the logical next step.
Atlas Course Scorecard™
| Category | Rating (out of 5) | Notes |
|---|---|---|
| Content Quality | ★★★★☆ | Well-structured, built by Google’s own analytics practitioners, recently modernized to Python |
| Practical Skills | ★★★★★ | Directly mirrors the tools listed in real entry-level job postings |
| Beginner Friendliness | ★★★★★ | No prerequisites, deliberately paced, builds from spreadsheets up to programming |
| Career Value | ★★★★☆ | Strong employer consortium and outcome data, though results vary by individual |
| Certificate Value | ★★★★☆ | Backed by ACE/ECTS credit recommendations, a rarity among short-form certificates |
| ROI | ★★★★★ | Roughly $300 total cost against a credential tied to $90K+ median entry-level salaries in the field |
Atlas Career Roadmap™
Beginner
    ↓
Google Data Analytics Professional Certificate
    ↓
Portfolio Projects
    ↓
Junior Data Analyst
    ↓
Business Analyst
    ↓
Senior Data Analyst
This reflects the realistic, most common path: start with no data background, complete the structured nine-course certificate, build out the capstone and any additional personal projects into a visible portfolio, land an entry-level analyst role, grow into a business-facing analyst position with more stakeholder responsibility, and eventually advance into a senior analyst role — often by that point supplementing this certificate with more advanced skills like Google’s Advanced Data Analytics or Business Intelligence certificates, or additional statistics and machine-learning training.
Is It Worth It?
Students. Yes — low cost, no prerequisites, and a genuine skill-building opportunity that complements almost any degree, with the added bonus of possible college credit through ACE or ECTS recommendations.
Career changers. Yes, and arguably the strongest-fit audience for this certificate specifically. The structured, sequential build from spreadsheets to SQL to Python is designed exactly for someone starting from zero technical background.
Professionals. Worth it if your current role touches reporting, planning, or decision-making and you want to stop relying on someone else to pull and interpret data — the SQL and spreadsheet skills alone tend to justify the ~$300 investment through improved day-to-day efficiency.
Freelancers. Worth it if you offer or want to offer data-adjacent services (reporting, dashboard-building, campaign analysis) to clients — the certificate adds credibility and the capstone doubles as a portfolio piece for pitching new work.
Entrepreneurs. Worth it for founders who want to make data-informed decisions about their own business without hiring a dedicated analyst — the practical spreadsheet, SQL, and visualization skills apply directly to sales, customer, and operations data most small businesses already have sitting unused.
Frequently Asked Questions
Is the Google Data Analytics Professional Certificate worth it? Yes, for beginners seeking a structured, low-cost path into an entry-level data analytics role — less so for anyone who already has solid SQL, spreadsheet, and visualization skills.
Is it beginner-friendly? Yes, no degree or prior data experience is required, and the curriculum builds sequentially from spreadsheets through SQL to Python.
How much does it cost? $49 per month in the U.S. and Canada, totaling around $300 for the typical 6-month completion pace.
How long does it take? Under 6 months at roughly 10 hours per week (about 180 hours of total instruction), though pace is fully self-directed.
Can I get a job after completing it? There’s no guarantee, but Google reports 75% of graduates experience a positive career outcome (new job, promotion, or raise) within six months, and completers can connect with a consortium of 150+ U.S. employers.
Is financial aid available? Yes, through Coursera’s standard financial aid application process on the certificate’s enrollment page.
Does it include a capstone project? Yes — Course 8 is a dedicated capstone where you independently apply the full analytics process to a real case study.
Can I add it to LinkedIn? Yes, the certificate is shareable directly to LinkedIn’s Licenses & Certifications section, backed by a verifiable Credly badge.
Is the certificate recognized by employers? Yes, broadly — particularly among the 150+ companies in Google’s employer consortium, including Deloitte, Target, Verizon, and Google itself, though recognition varies by employer.
Does the certificate teach Python or R? Python. Google moved fully to Python in its 2026 curriculum update and no longer teaches R, though it encourages learners to explore R independently afterward.
Does it teach Tableau? Yes, Course 6 is built specifically around data visualization and dashboarding using Tableau.
Is there a free trial? Yes, a 7-day Coursera free trial, though the certificate itself can’t be earned during that free window.
Can I audit the course for free? You can preview the first module of many included courses at no cost, but full completion requires a paid subscription or approved financial aid.
Does the certificate offer college credit? It carries an ACE recommendation of up to 12 college credits (U.S.) or 7 ECTS credits (Europe), though acceptance is decided individually by each institution.
What jobs can I get after this certificate? Common entry points include Junior Data Analyst, Business Analyst, Marketing Analyst, Operations Analyst, and Reporting Analyst.
How many courses are in the certificate? Nine, including a capstone project and a bonus AI-powered job-search course.
Do I need to take the courses in order? Google recommends it, since each course builds on skills and concepts from the ones before it.
Is the certificate available in languages other than English? It’s currently taught in English, with several Google Career Certificates also available in Turkish, German, Spanish, Arabic, Russian, and Indonesian, with more languages planned.
How is this different from IBM’s Data Analyst certificate? Both are similar in structure and beginner focus; IBM’s track goes somewhat deeper into Python’s data-science libraries and dashboarding tools like Cognos, while Google’s leans broader across the full analytics workflow.
How is this different from the Microsoft Power BI certificate? Microsoft’s certificate is built around mastering a single tool (Power BI) and preparing for the PL-300 exam, while Google’s covers a broader multi-tool analytics workflow.
Should I take the Google Business Intelligence Certificate instead? Only if you’ve already completed Google Data Analytics or have equivalent experience — Business Intelligence is explicitly an advanced follow-on program, not a beginner starting point.
Does the certificate include AI training? Yes, both within the capstone course (AI-assisted data cleaning and visualization) and in the dedicated bonus course, Accelerate Your Job Search with AI.
What is the average salary for data analytics roles? Lightcast job-postings data cited by Google shows a median entry-level salary around $97,000 in the U.S. for data analytics roles broadly — this reflects market demand for the role, not a guaranteed outcome from the certificate itself.
Is prior programming experience required? No — the Python course is built for absolute beginners and is the seventh course in the sequence, after spreadsheets and SQL fundamentals are already established.
Conclusion
The Google Data Analytics Professional Certificate earns its reputation honestly: it’s not the most technically advanced data credential available, but it doesn’t try to be. It’s built to do one thing well — take someone with no data background and get them to a genuinely job-ready, entry-level skill set in spreadsheets, SQL, Tableau, and now Python, backed by a real capstone project and a credible employer network. For students, career changers, and professionals who want to add data literacy to their toolkit, it remains one of the strongest, lowest-risk entry points into the field.
Related Professional Development Guides
Leadership rarely develops in isolation — it usually pairs with a handful of other practical workplace skills. If you’re building out a broader professional development plan, these guides cover the skills that most often complement leadership training:
- Best Communication Skills Courses Online
- Best Excel Courses Online
- Best Microsoft Word Courses Online
- Best PowerPoint Courses Online
- Best Leadership Courses Online in 2026
- Best Project Management Courses Online in 2026
- Free Online Courses for Skill Upgrade in 2026: The Complete Global Guide
- Google AI Essentials Review (2026): Everything You Need to Know Before You Enroll
- Google AI Professional Certificate: The Complete 2026 Review